09/14/2024 - Benchmarking and when things don't always make sense
Sometimes, when you run benchmarks, the results don't make a lot of sense. This is one of those times.
Our benchmarks are often run on AWS i4i.metal "bare metal" instances. These are reasonably modern dual-socket, 3rd gen, Scalable Xeon Platimum systems with 8 3.75 TB local NVMe SSDs. All in all, a fairly fast system.
When comparing performance with stock RAID-0 arrays, a curious anomoly was encountered. The RAID-0 8K random read numbers were much worse than 8K random read number with an ESS volume. The difference is quite striking. Our test in this case is a GO program that does O_DIRECT random IO with aligned buffers. Queue depth is controlled by "go threads", in this case set to 120. This is similar to running FIO with O_DIRECT, but not using the LibAIO library. In general, Q=120 should be high enough to get 8 SSDs at least somewhat busy.
The test had three parts:
- Fill 500 GB with random blocks. This is 1MB linear writes at Q=8.
- Write 16K random blocks at Q=120 for 60 seconds.
- Read 8K random blocks at Q=120 for 60 seconds.
This test was run at RAID-0 with both the stock array and with ESS on top of the exact same array.
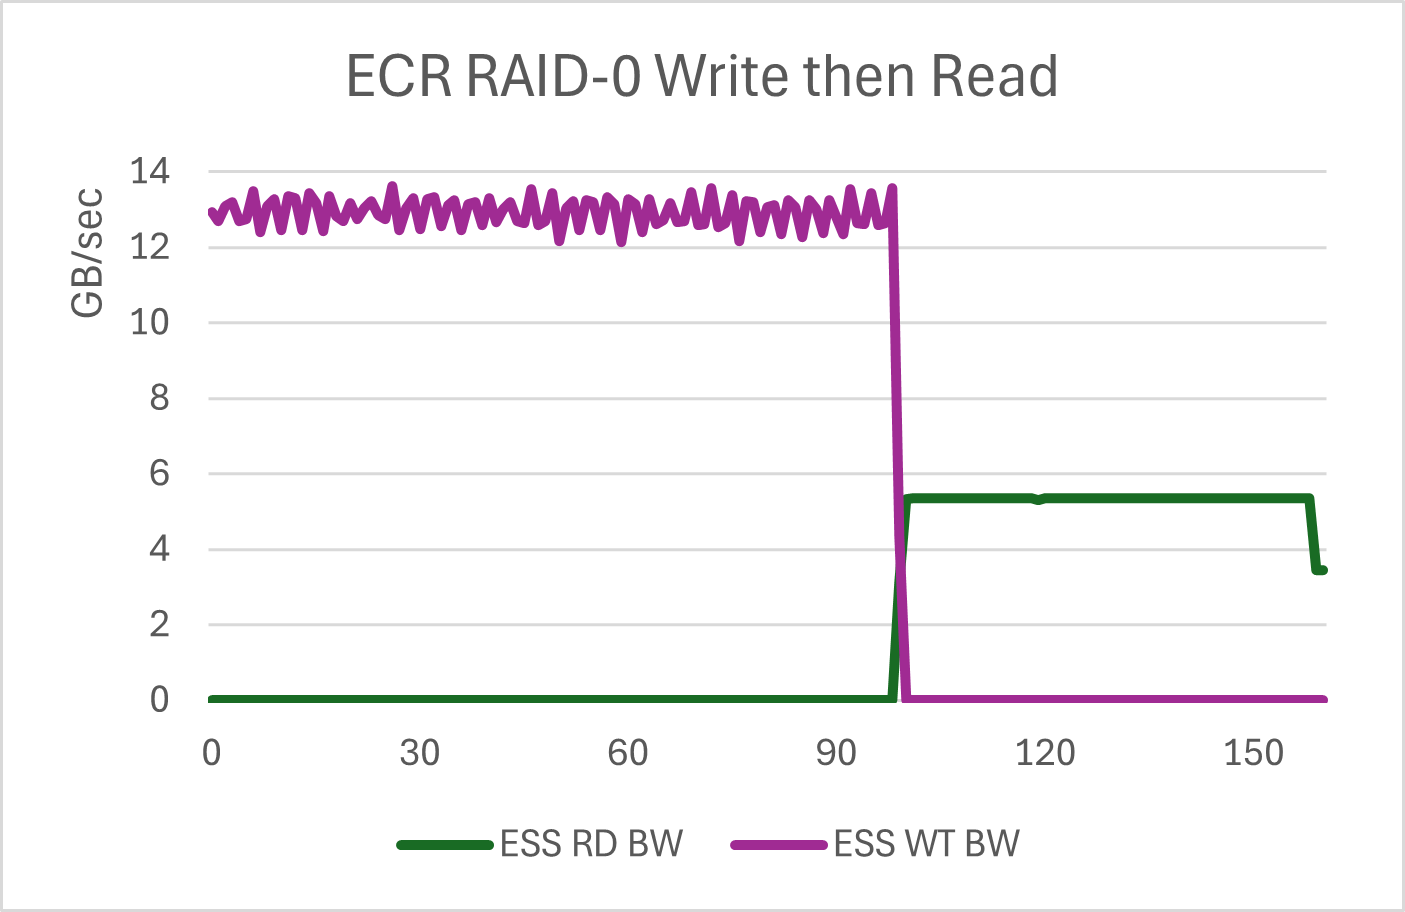
Here is the IO bandwidth graph of the ESS/RAID-0 test. Vertical units are GB/sec. The horizontal scale is time in seconds. Each third of the graph is the initial linear fill, the 16K random writes, and then the 16K random reads. It is somewhat hard to see the transition from linear to random writes. This is a feature of ESS. Up to a point, writes tend to run at the speed of the media, regardless of block size.
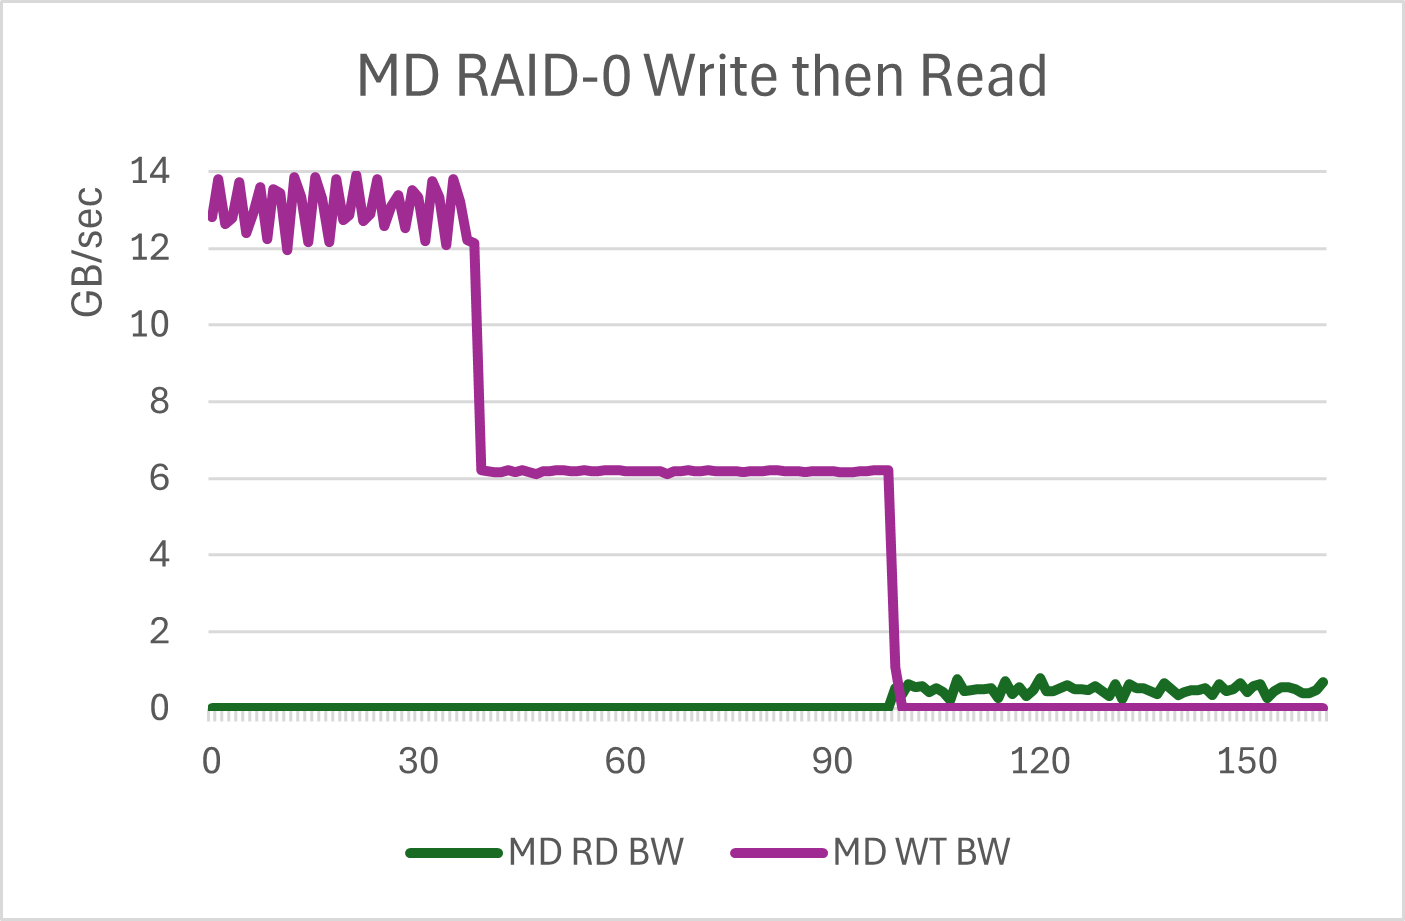
We then run the same test on the backing /dev/md5 device. Same parameters, same disks.
You can see that the ESS write numbers are better for 16K random writes. This is expected. What is not expected is that the read numbers for ESS are far better as well. 5.5GB/sec vs 200MB - 700MB/sec. The stock SSDs in RAID-0 just don't like to do these reads. Not only is the bandwidth low (along with the IOPS), but they are bouncing all over the place. This is over a 10X differential.
'iostat' during this run confirms that /dev/md5 is getting Q=120 requests. None of the schedulers are any different between the runs. Just something about the buffering of ESS is keeping the array much busier.
Bottom line, it appears that ESS isolates the SSDs in a manner that allows them to do more work. The ESS numbers are as expected. The stock RAID numbers are what is surprising. If this were RAID-5, there are lots of explanations, but RAID-0 should be a very "pass thru" scenario for MD RAID.
But there is more to this. This test is at Q=120 without LibAIO. If we re-run the test at Q=32 and LibAIO=16 using FIO, the results change.
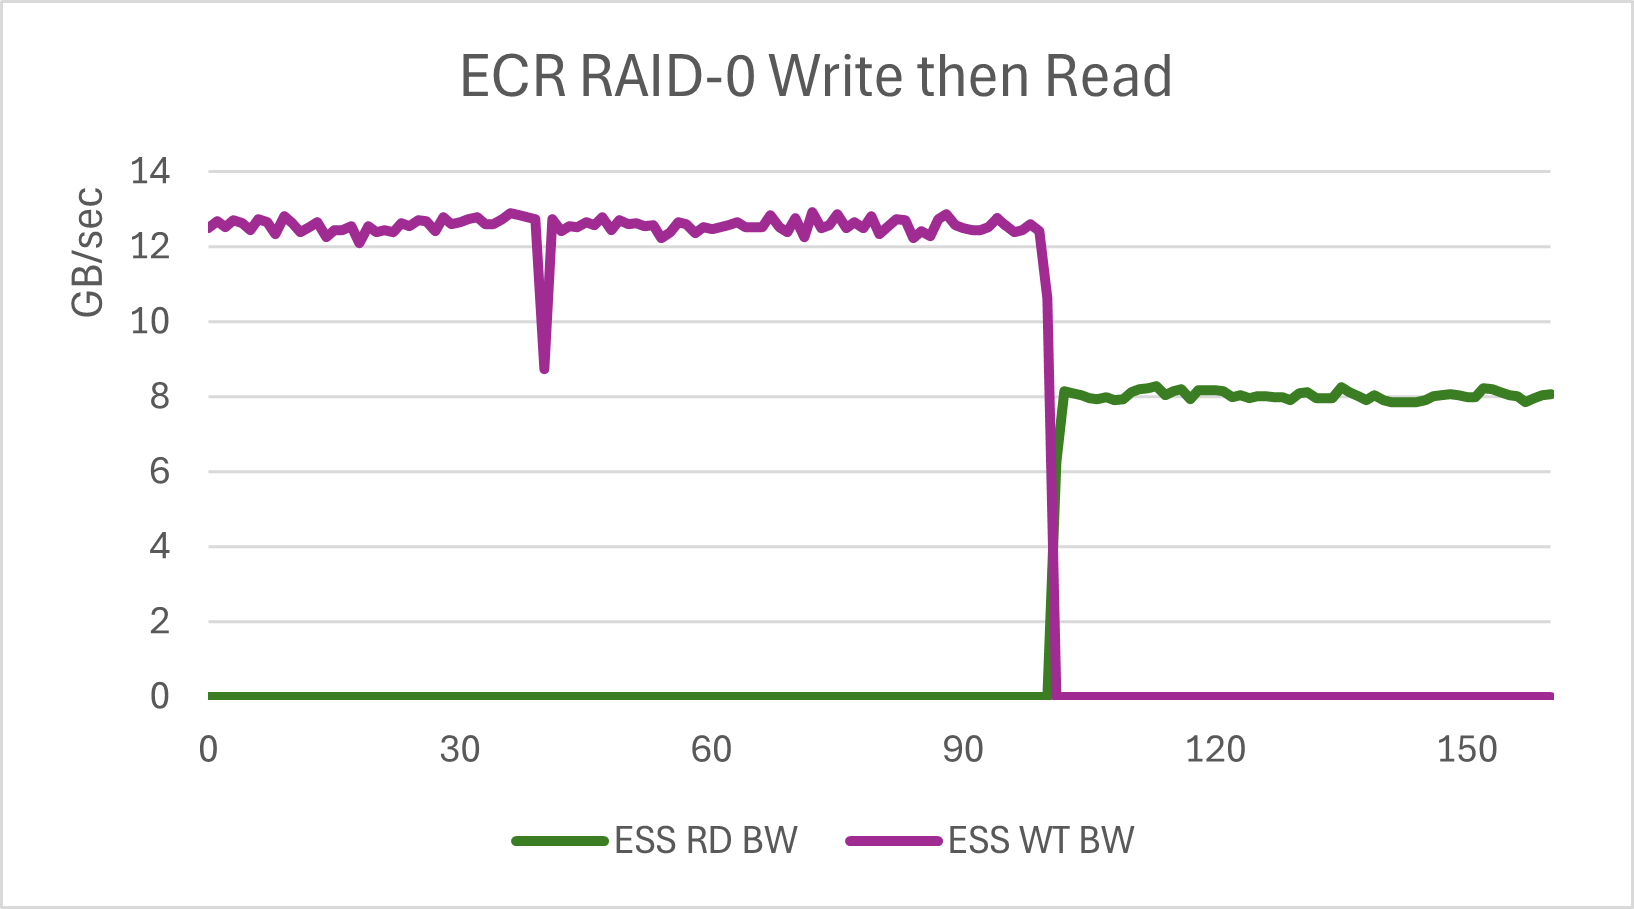
Here the ESS chart is similar. Reads go up a little with the higher queue depth. Writes are unchanged. The dip at about 45 seconds is the transition from fill to random writes and likely is the startup time of FIO.
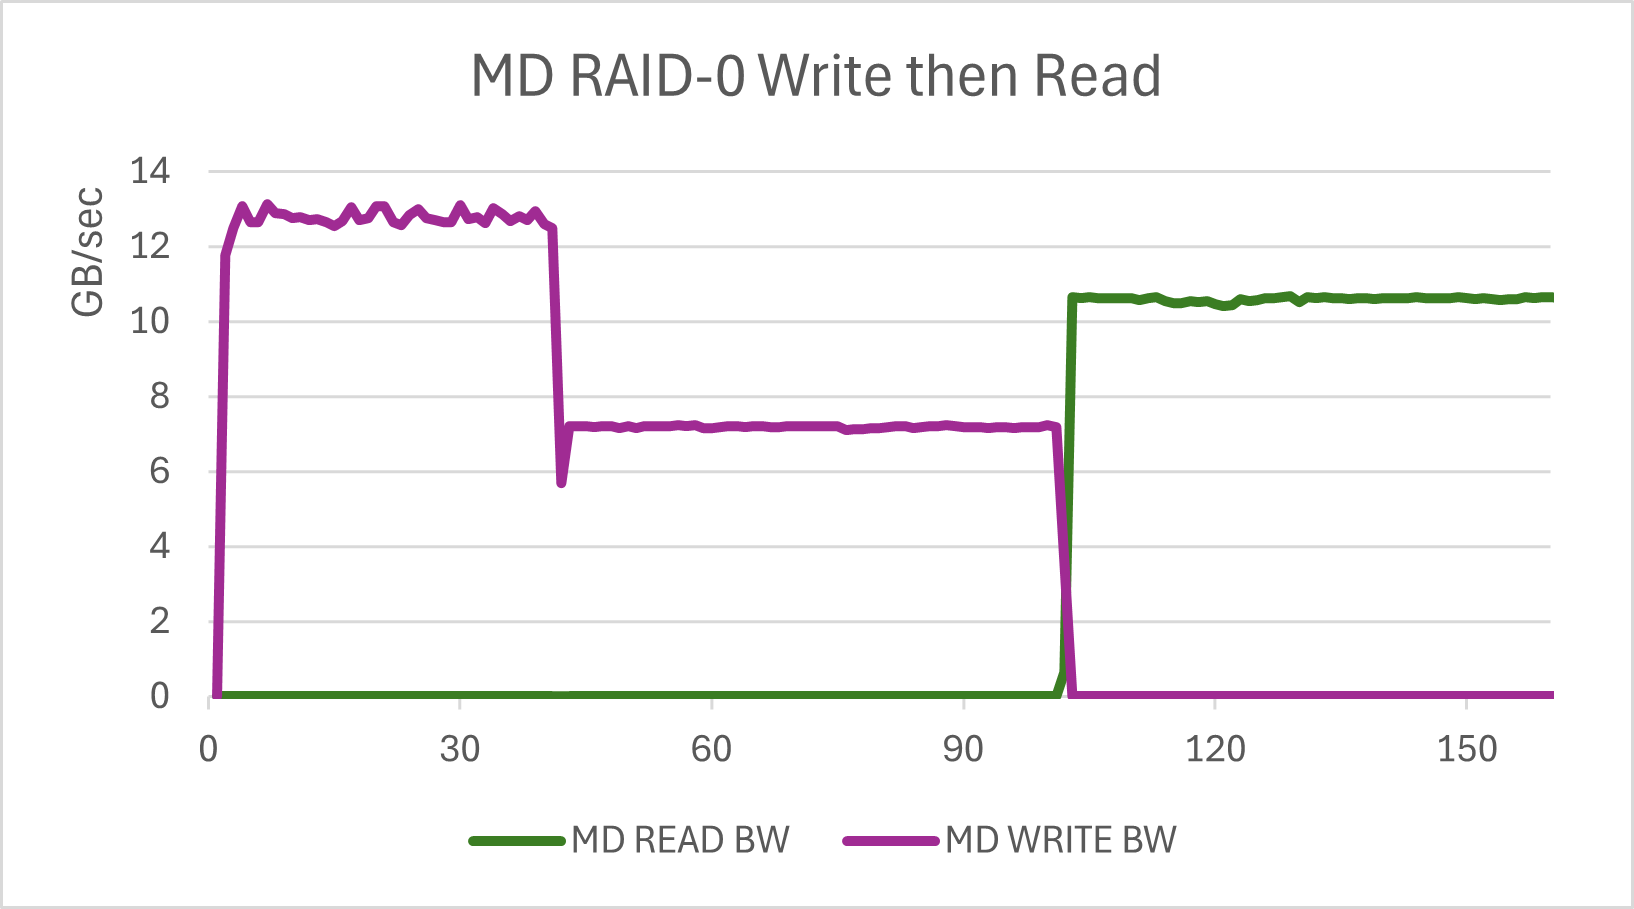
With the bare RAID-0 array, writes are mostly unchanged. Reads get a lot better, so much so that the increased queue depth alone does ot account for the variance. The queue depth is 8X, but the results are closer to 20X with far lower variability. This implies that stock RAID-0 with lower queue depth is arbitrarily adding latency. This would make sense if a queue scheduler was in place, but the queue scheduler for RAID-0 is noop and the queue schedule for NVMe SSDs is also noop.
Bottom line, the queue depth can shift results quite dramatically. I actually care more about performance at moderate queue depths. Running tests at Q=1000+ can get you impressive results, but does this really represent your workload. Q=120 seems more reasonable, at least to me.
Copyright © 2024 EasyCo LLC dba WildFire-Storage